For the souce code, please see here.
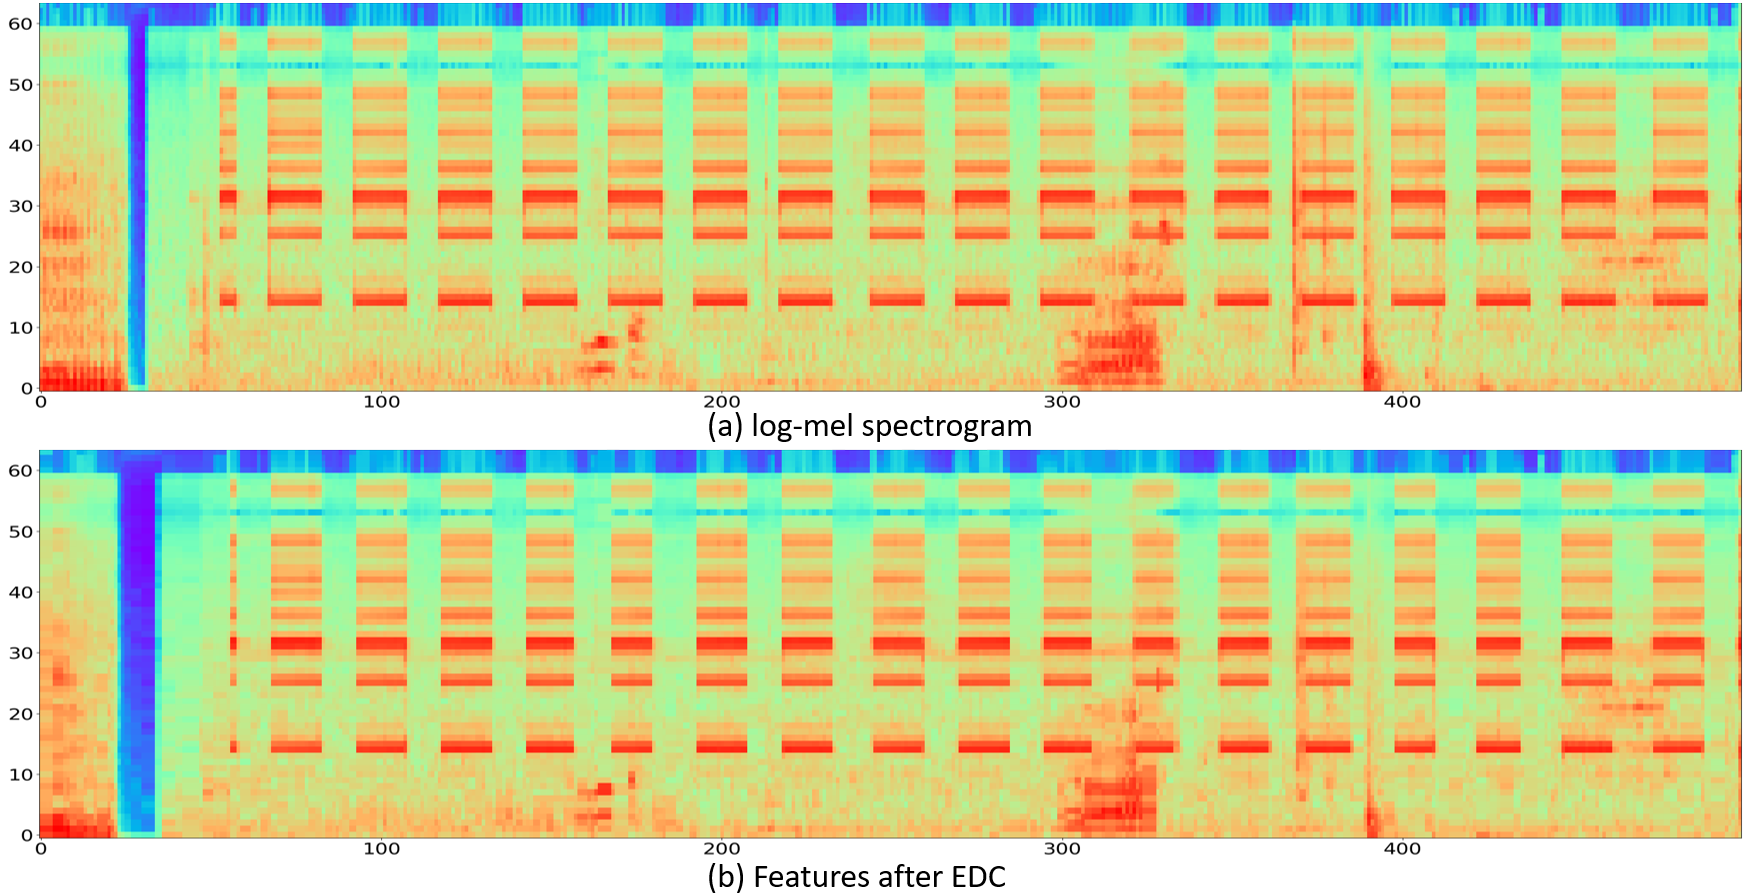
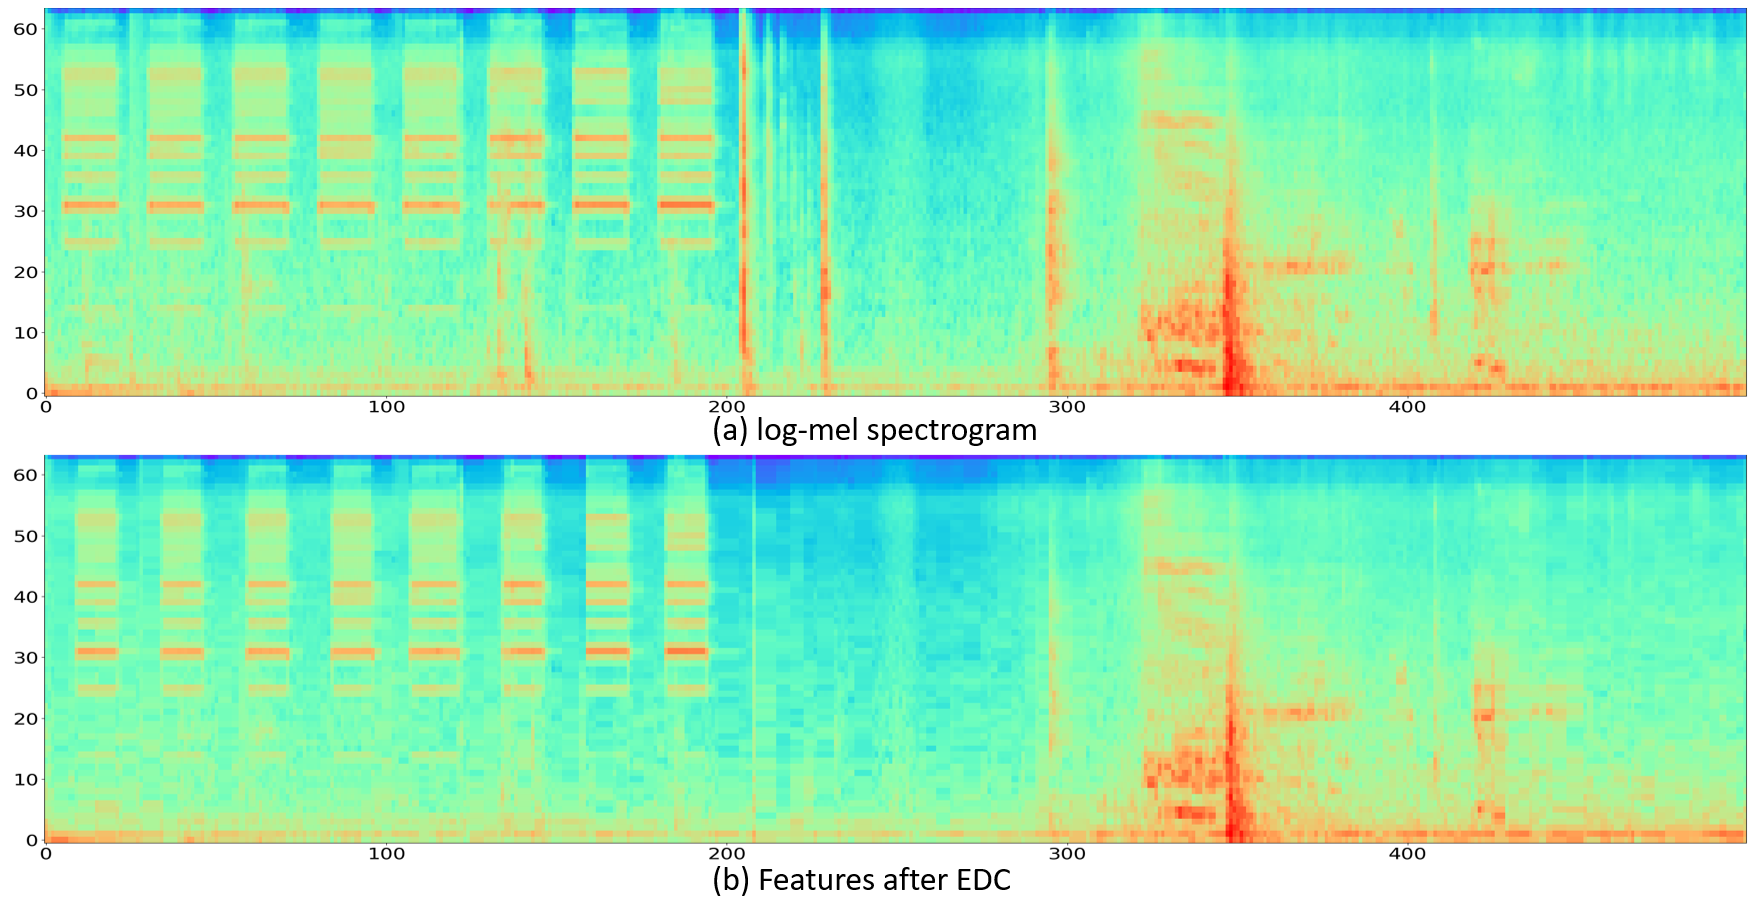
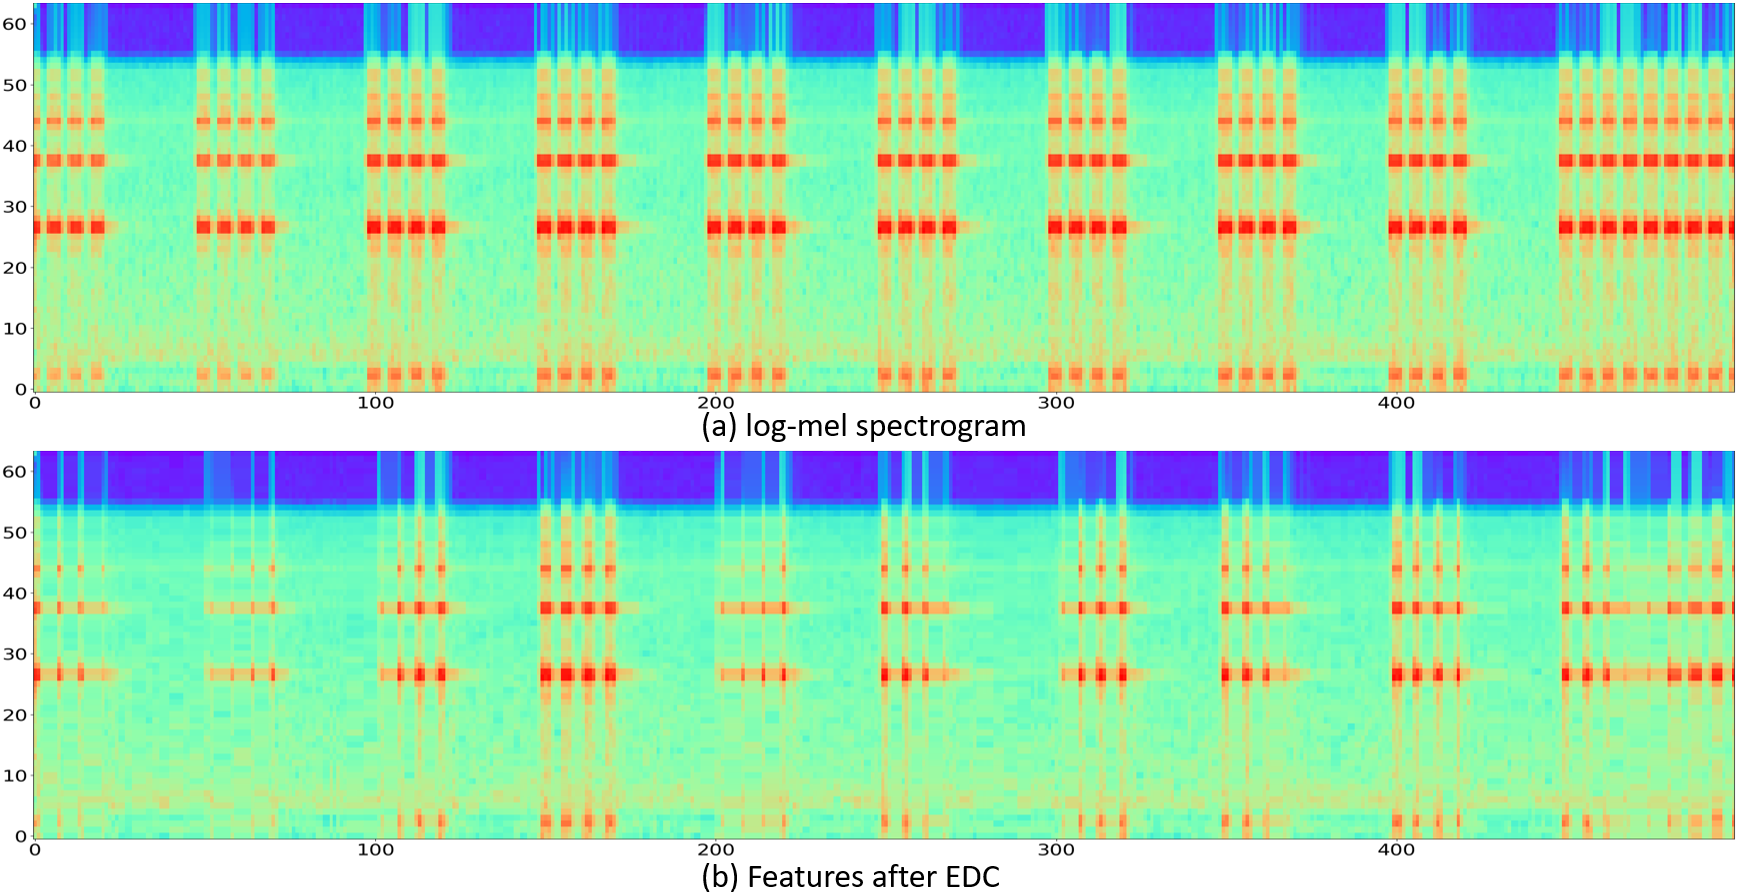
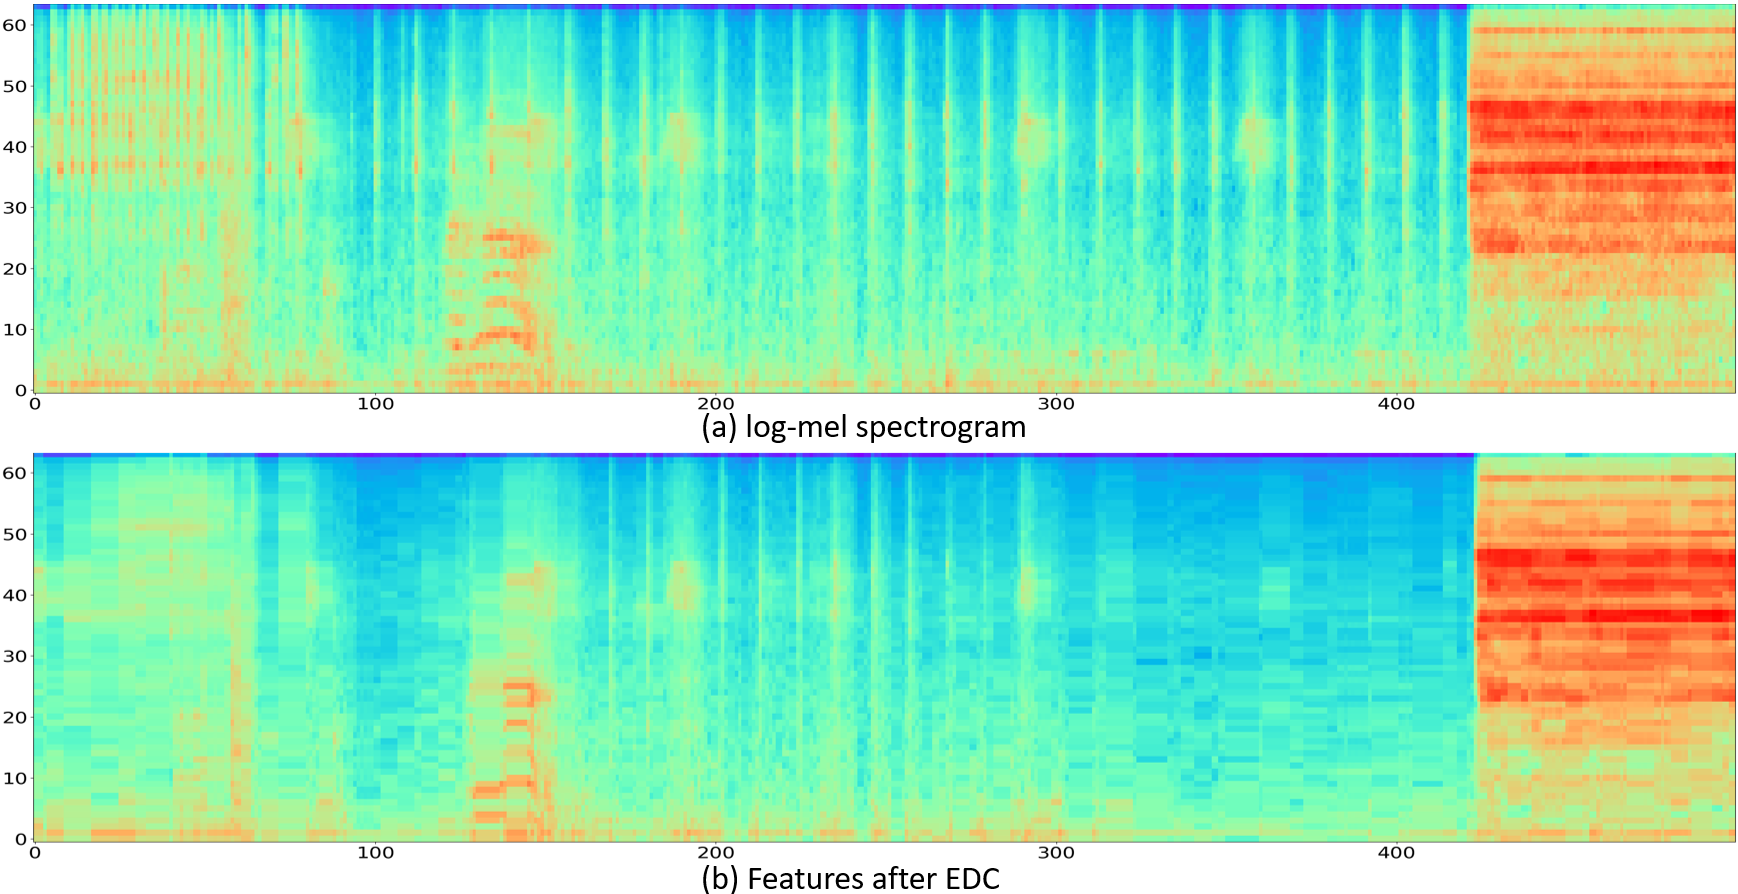
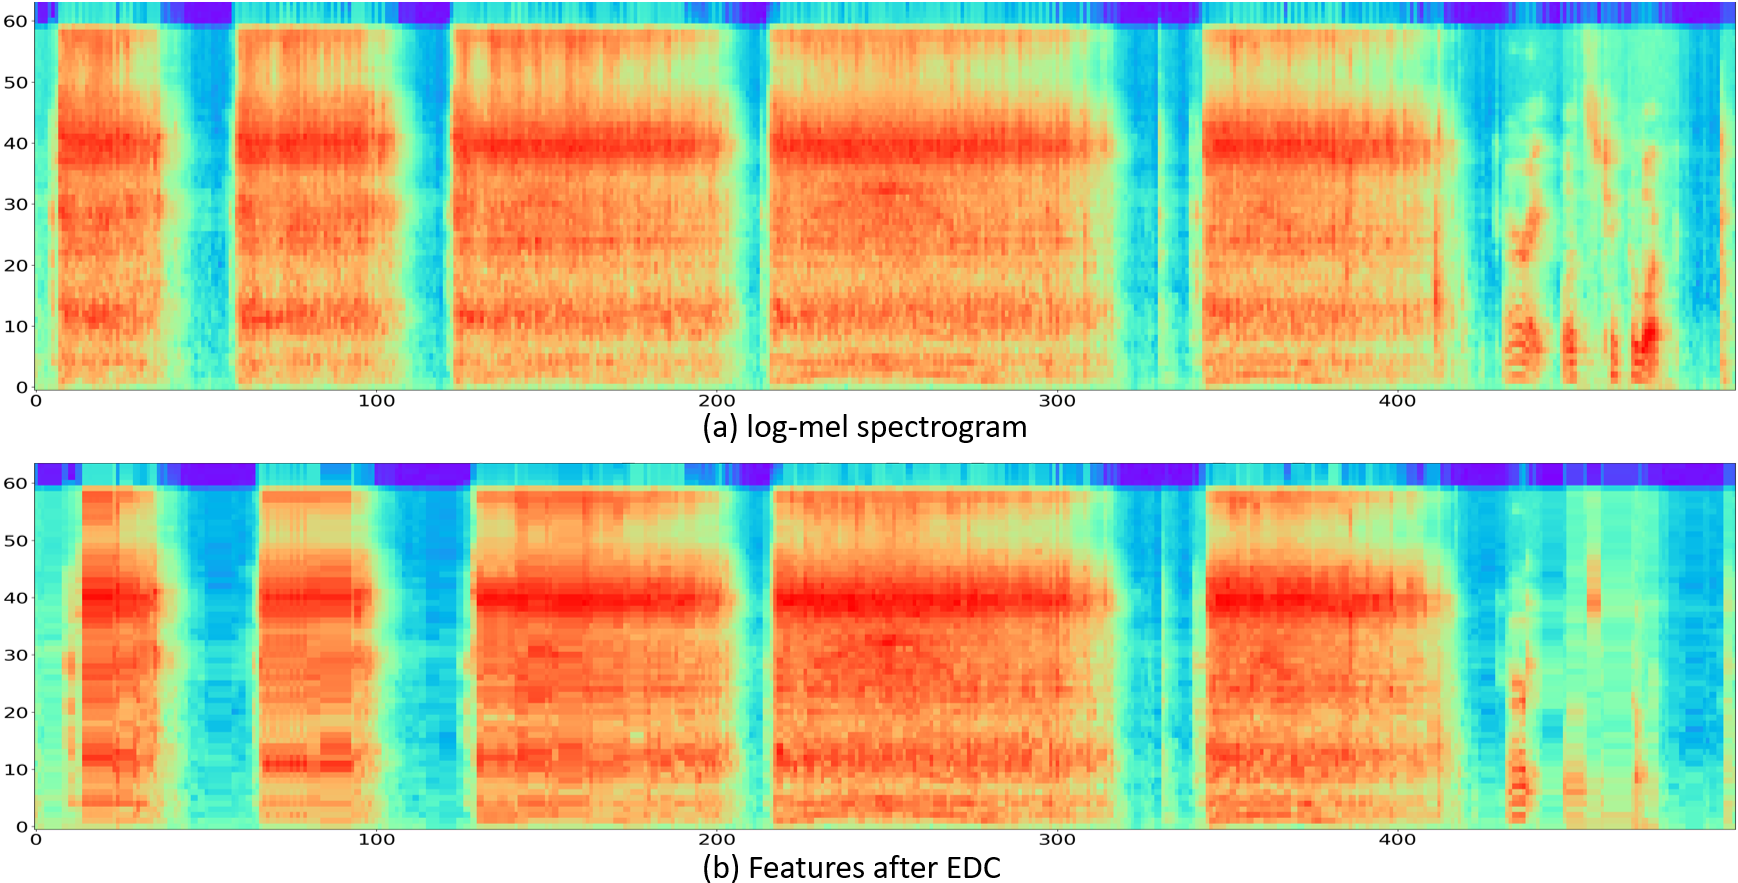
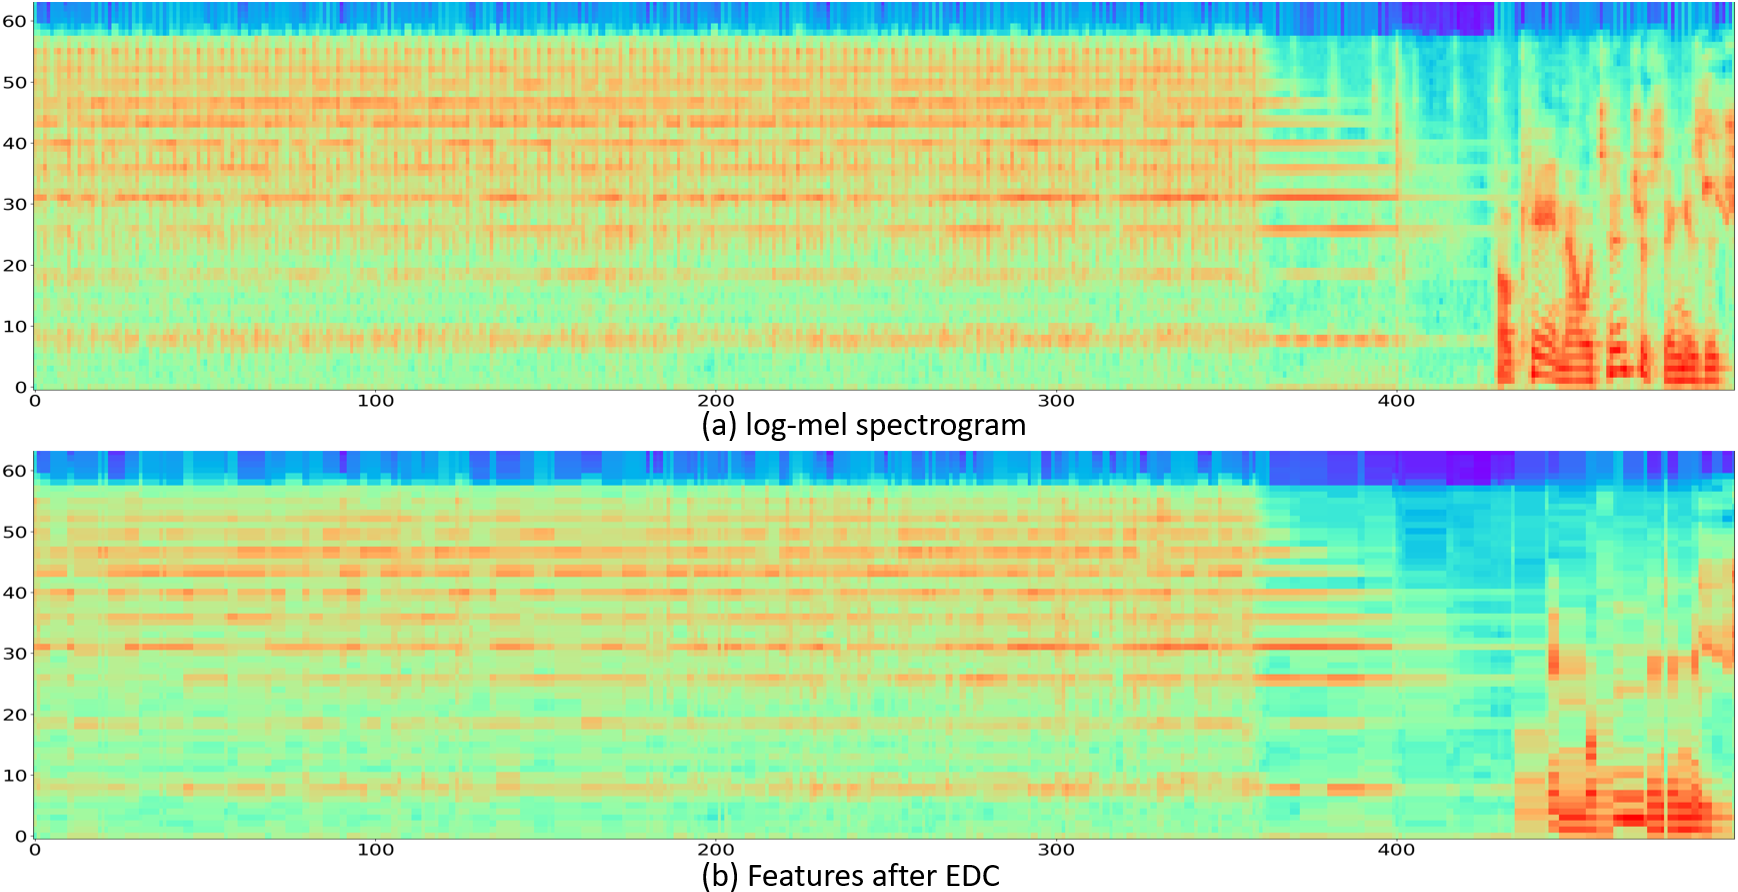
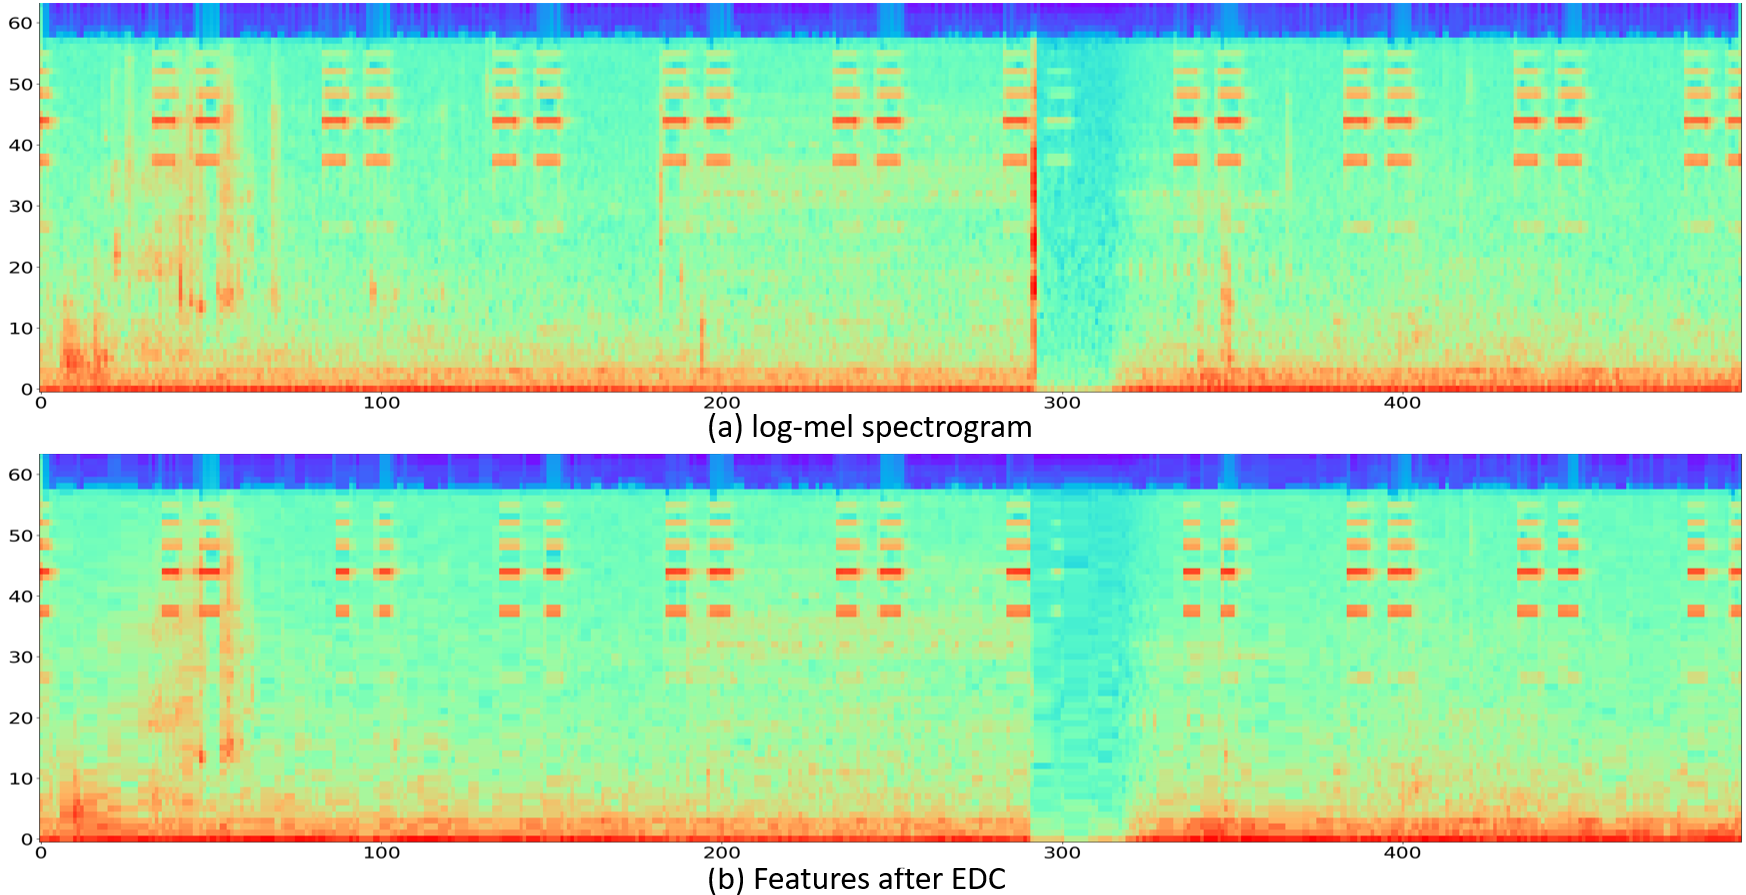
Feature comparison (Best viewed in color)
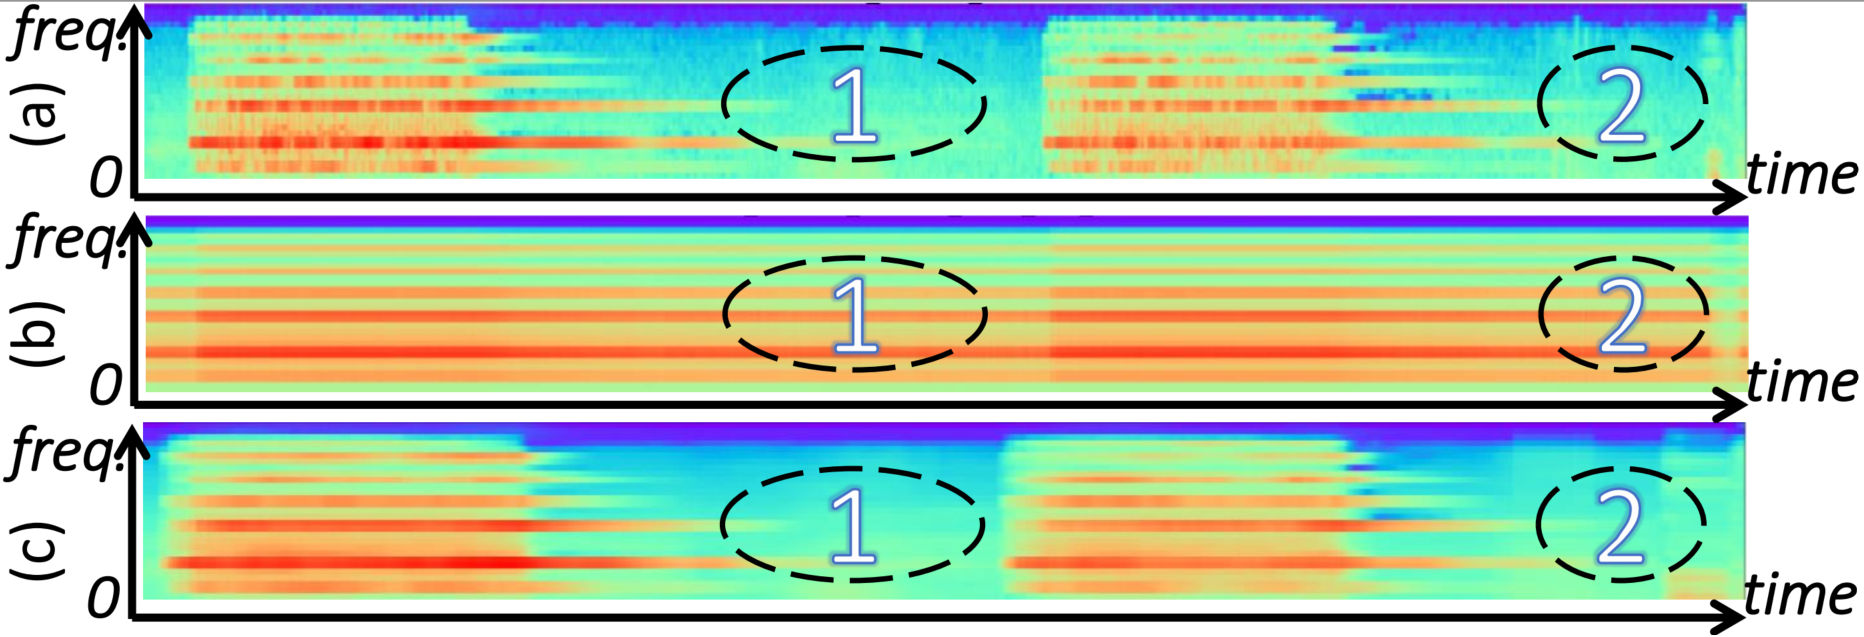
Subgraph: (a) Log mel spectrogram; (b) Features after the self-attention; (c) Features after EDC.
A detection demo of the siren sound clip
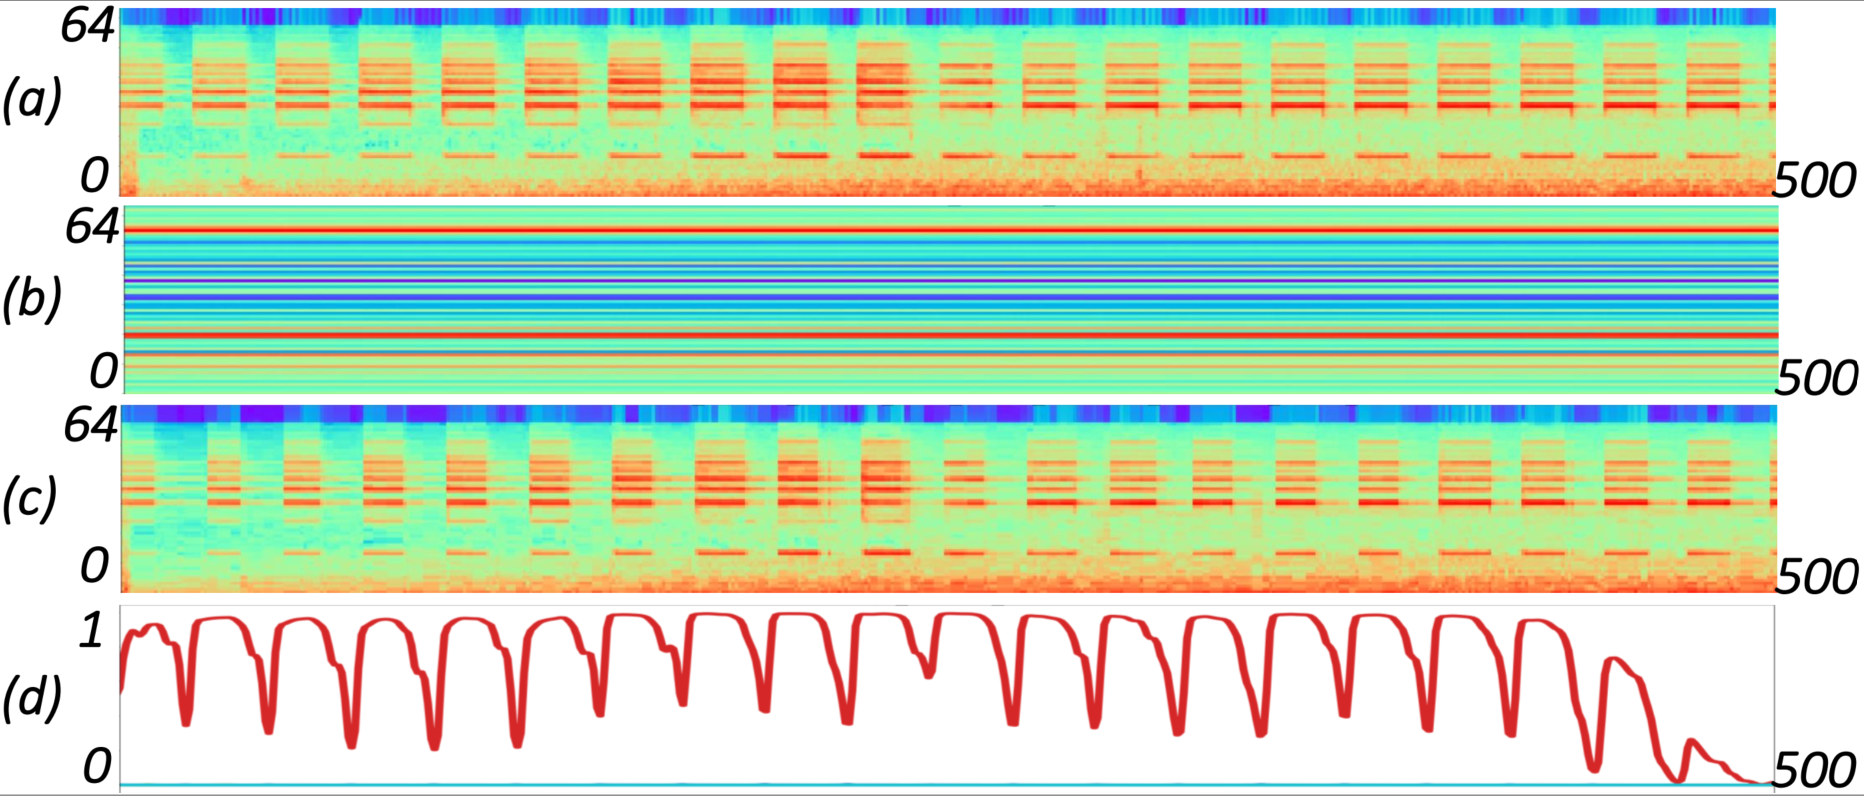
Subgraph: (a) Log mel spectrogram; (b) Bottleneck features from the trainable self-attention layer; (c) Acoustic features after EDC; (d) The probability of events
predicted by the model trained with EDC.
Visualization of frame-level representations distribution
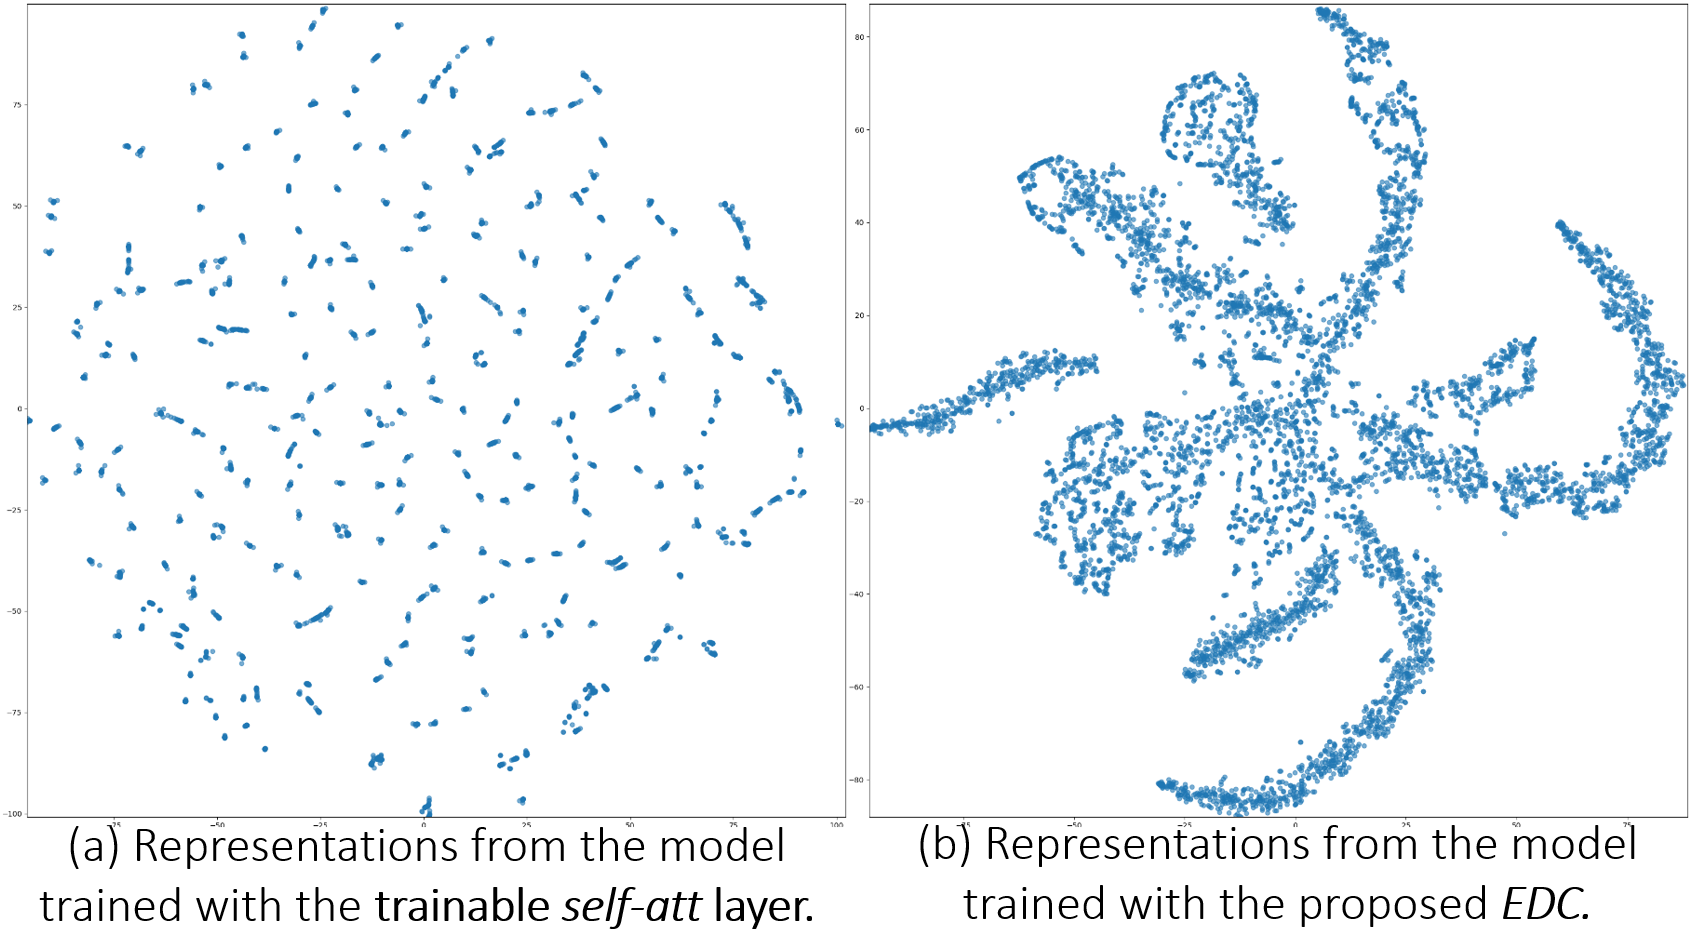
Visualization of frame-level representations distribution using unsupervised t-SNE.
Please note that models in this paper are trained by clip-level weak labels in datasets of DCASE and CHiME, and the label of each audio clip is a multi-hot vector, so the label corresponding to the frame-level representation is unknowable.
Please note that models in this paper are trained by clip-level weak labels in datasets of DCASE and CHiME, and the label of each audio clip is a multi-hot vector, so the label corresponding to the frame-level representation is unknowable.
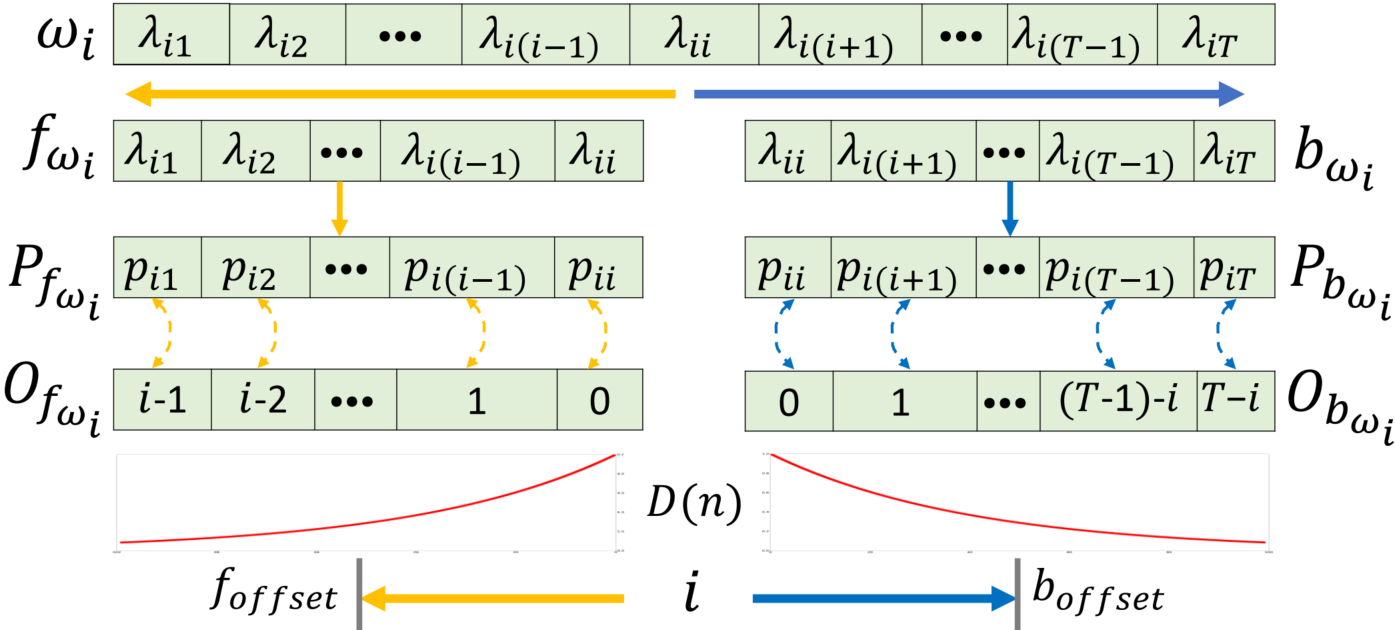
The calculation procedure of EDC
For the souce code, please see here.
Attenuation curves of different alpha
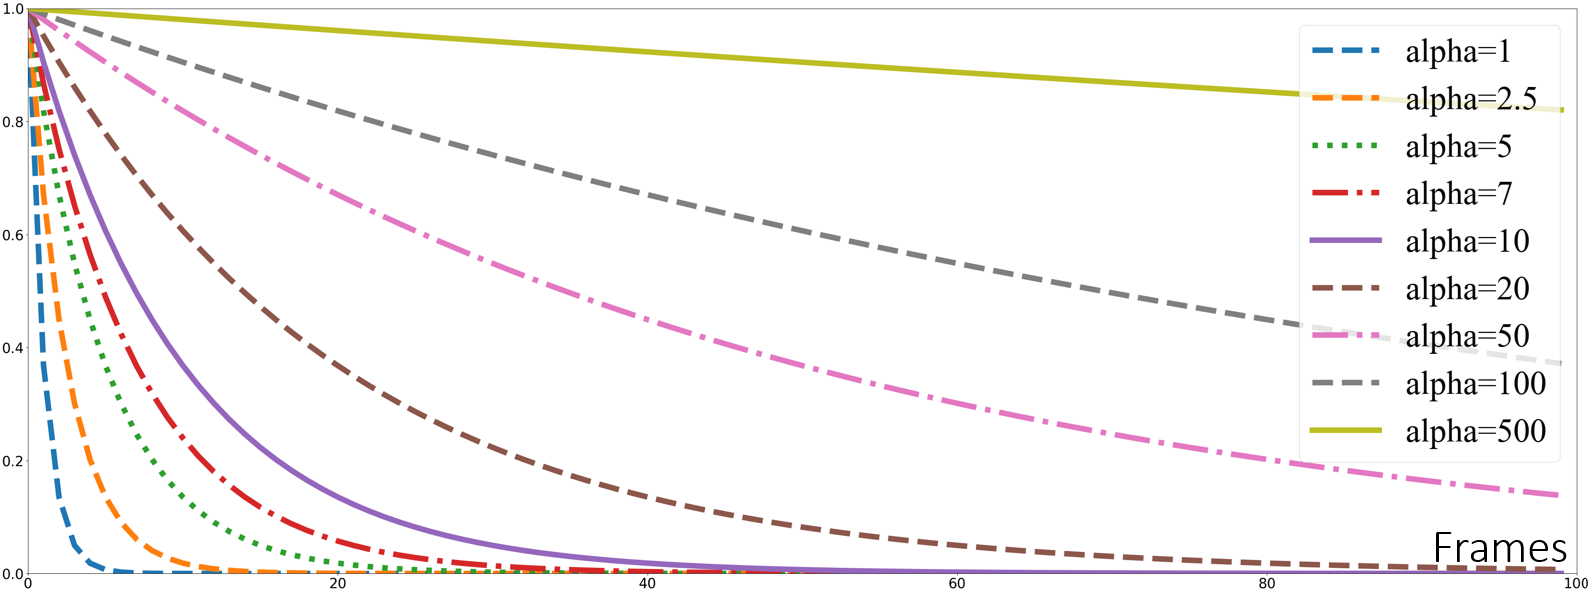
Assuming that the attenuation starts from frame 0
Further comparison of the effects of EDC
Sample 1
Sample 2
Sample 3
Sample 4
Sample 5
Sample 6
Sample 7